

A $150,000 House In 1988 Now Costs $707,500; Thank You, Fed!
Authored by Mike Shedlock via MishTalk.com,
The Fed has grossly distorted the housing market and no fix is in sight. A couple of images will explain…
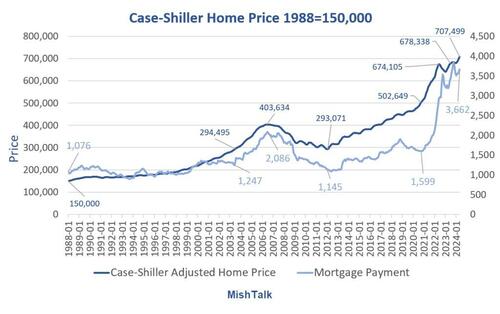
Chart data from Case-Shiller, mortgage calculation based on Fannie Mae 30-year mortgage rates, chart by Mish
Home Price Calculation Notes
-
Case-Shiller measures repeat sales of the same home over time.
-
Case-Shiller is a much better, but less timely measure than median or average home price. However, the measure lags. Recent data is through May representing sales in February, March, and April.
-
The price above reflects the increasing value of the Case-Shiller index over time.
Mortgage Payment and Mortgage Rate
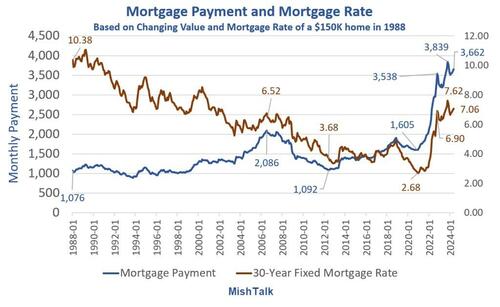
The above chart represents the mortgage payment of the same house as the lead chart reflecting the changing price and interest rate over time.
Price, Mortgage Rate, Mortgage Payment Over Time, Same House
-
The $150,000 home purchased in January 1988 had a mortgage payment of $1,076 reflecting a mortgage rate of 10.38 percent.
-
In 2006, the home was worth about $403,634 up and the mortgage payment was $2,086 reflecting a mortgage rate of 6.52 percent.
-
If you bought at the end of 2020 when the Fed clobbered interest rates to a record low of 2.68 percent, that same home that cost $150,000 in 1988 would have cost $502,649. However, due to Fed “affordability” magic, the mortgage payment was only $1,605. Thank you Fed!
-
However, if you want to buy now (May 2024) that $150,000 1988 home will set you back a mere $707,499. Your mortgage payment would be $3,662 at a mortgage rate of 7.06 percent. Oops and Ouch!
It’s Worse Than Described Above
Mortgage rates are slightly higher in practice.
Also, prices do not include property taxes or insurance.
Mess Entirely of Fed’s Making
This is a mess entirely of the Fed’s making. And it’s what happens when the Fed, and economists in general do not count home prices as inflation.
Home prices are not directly in the CPI or PCE. The latter is the Fed’s preferred measure of inflation.
Economists consider home prices a capital expense not a consumer expense. The problem is simple: Inflation is not just a consumer price concern!
The Fed ignored obvious inflation in the Great Recession and did so again in the Covid recession.
Existing Home Sales Drop 5.4 Percent But Median Price Hits New Record
Existing-home sales declined 5.4 percent in June. It was the 23rd decline in 29 months. But the median price hit a new record.
For Discussion, please see Existing Home Sales Drop 5.4 Percent But Median Price Hits New Record
Existing-home sales are about where they were in December 1995 and May 1979!
Only price-insensitive buyers, the newly rich, or those who just sold their previous house, can afford to buy.
All-cash sales accounted for 28% of purchase transactions in June.
Housing, Rent, CPI Indexes Jan 2020 vs May 2024
-
Housing: 212 to 323, +52.4 Percent
-
Rent 187 to 231, +23.5 Percent
-
CPI: 153 to 185, +20.9 Percent
Haves vs Have Nots
Existing homeowners who refinanced near or perhaps even under 3.0 percent have extra money in their pocket every month to spend. And they do.
Those who spend every penny then have an unexpected expense or a big rent increase are in trouble.
The group of people who were doing OK but now aren’t is expanding. Also the unemployment rate is rising and small business employment is in a serious nose dive.
Small Business Employment Growth Is Now Negative
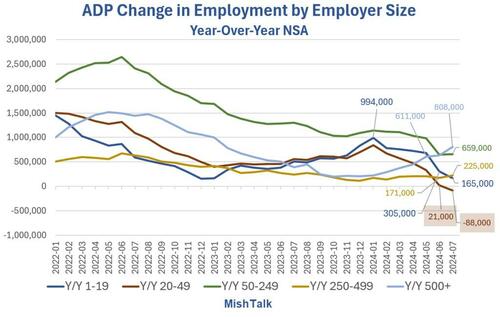
Data from ADP, chart by Mish
For discussion, please see Small Business Employment Growth Is Now Negative (and What It Means)
ADP data shows year-over-year payroll growth is negative 88,000 for small corporations sized 20-49. Trends are negative in all but very large corporations.
On July 26, I commented Expect the BLS to Revise Job Growth Down by 730,000 in 2023, More This Year
At the heart of these revisions is a horribly flawed birth-death model used by the BLS. My calculation closely matches an estimate by Bloomberg’s chief Economist.
In addition to the birth-death model, or perhaps explaining the birth-death model errors, small business employment is declining fast.
Unemployment Rate Jumps, Jobs Rise Only 114,000 with More Negative Revisions
On August 2, I commented Unemployment Rate Jumps, Jobs Rise Only 114,000 with More Negative Revisions
The headline jobs number was much weaker than the consensus estimate of 180,000 and the unemployment rate rose 0.2 percentage points.
The McKelvey (Sahm) Unemployment Rate Recession Rule Just Triggered
On July 8 I commented Weak Data Says a Recession Has Already Started, Let’s Now Discuss When
I did an update on August 2 using a tighter trigger.
Also on August 2, I commented The McKelvey (Sahm) Unemployment Rate Recession Rule Just Triggered
Recession with rising unemployment rates and 15,000 Layoffs at Intel is not the best environment to be buying a house even if mortgage rates have declined.
Tyler Durden
Tue, 08/13/2024 – 13:40
