

It’s The Positioning, Stupid!
By Maartje Wijffelaars, Senior economist at Rabobank
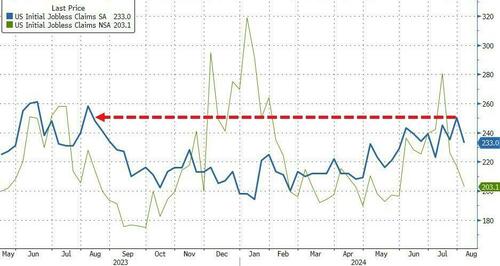
US jobless claims were down by 17,000 to 233,000 in the week that ended 3 August. The drop was largest in almost a year’s time and lower than expectations (240,000), although the latter is anything but unique. Continuing claims edged up and reached their highest level since end November 2021, though, underscoring that unemployment is still trending upwards and that the labour market continues to cool. Yet, the figures sent both stocks and yields higher as it lowered both – in our opinion overdone – fears of a hard landing and rate cut expectations.
The S&P 500 ended the day 2.3% higher, while 2-year and 10-year treasuries were up 8 and 5 basis points, respectively to 4.04 and 3.99. Note, though, that while traders have cut back on their expectations of aggressive Fed cuts, the OIS curve still prices for a 37bp cut in September and 100 basis points through the end of this year. The US job figures also helped European stock markets pare losses, with the Euro Stoxx 600 going up from -1.2% to -0.4% right after publication and ending the day flat.
Given it’s our weekly wrap-up, let’s take a step back to evaluate past week’s developments. It has been marked by significant stock market drops across the globe, the largest one day move in the VIX ‘fear’ index in history, aggressive rate cut bets in the US, and strong FX movements. The stark appreciation of the yen against the dollar was arguably one of the most sensational. Macro triggers ranged from an only partially priced-in rate hike in Japan combined with a hawkish comment, to weaker than expected activity and employment data in the US, several disappointing revenue reports from the US techs, and the unwinding of yen carry trades as a result.
Opposite movements took place in the days after, as some sense returned and the acknowledgement came that overselling had taken place. Central bankers in the US tried to convince markets it would not react to the turbulence and that one weak data point doesn’t make for a crisis. The BoJ instead told markets that it actually would take turbulence into account, hinting that it wouldn’t hike fast. Furthermore, several earning reports coming in actually weren’t that bad. Despite pull back against the initial movements, the US dollar and stock markets around the globe are still down from last week’s high, and the Japanese yen up from last week and even more so compared to early July.
All that being said, it were not merely macro developments that caused past week’s turmoil. Quite the opposite, in fact, argues our senior cross-asset strategist Christian Lawrence. Equity positioning was heavily stretched with multi-year low volatility driving asset managers allocating by vol targets into equities. In fact, an S&P500 vol control fund with a 15% target was max long equities, so any spike in volatility was likely to trigger equity selling. The rise in systematic or ‘rules-based’ trading means that the market is prone to one way traffic at times.
The initial trigger behind the spike in volatility was the Bank of Japan’s announcement of an interest rate hike and asset purchase slowdown. Heading into that decision, the market was the most short JPY since 2007 as the currency was used to fund carry trades. In the FX world, that looked like borrowing JPY and buying a high yielder such as the Mexican peso. But US equity investors also borrowed in JPY to buy equities. The rise in JPY as a result of the BoJ announcement triggered a mass unwind of those carry trades and that triggered equity selling that also pushed the index through key technical levels that forced momentum strategies to start selling as well.
As volatility rose, vol targetters had to sell more and a snowball effect took hold with discretionary managers also jumping on the move. Credit markets moved but remained orderly, pointing to the structural factors exacerbating the equity moves. That said, rates were not immune and buying of US Treasuries surged. The softer than expected labor report on Friday was viewed as a major driver of that move with the rise in unemployment to 4.3% triggering the Sahm rule and implying a recession could be coming. Economic data are slowing, but they are not suggesting an economic collapse that would justify the price action, which, in its extreme briefly resulted in the market implying 150bp of cuts by year-end across just three meetings.
Rates volatility was significant with the 2yr UST trading a 43bp range. Price action soon moderated however, as vol sellers emerged to push the VIX down from its extremes and as that happened, the changing volatility landscape helped break the snowball. This episode points to how the roles of market structure and positioning extremes can cause dramatic moves over short periods that cannot be justified by underlying fundamentals.
In other news, energy prices have moved upwards this week. Oil recovered from a 7-month low on Monday to USD 79 per barrel, as tensions are building in the Middle East, production has been cut in Libya and Ukraine is performing attacks on Russian soil. Israel, and the world for that matter, is preparing for an attack by Iran and its axis of resistance as retaliation for Israel’s assassination of the Hamas and Hezbollah leaders. Iran has told France it is looking for diplomatic de-escalation, but the situation remains very tense, to say the least.
Weak demand is still keeping a lid on prices and according to our energy analyst Joe DeLaura, it would take actual disruptions to oil flowing through the Persian Gulf – as a result of attacks on oil facilities in the region by Iran and its proxies and/ or blockades to transport – to send oil prices significantly upwards. But if it were to happen, we should embrace ourselves for spiralling oil prices far over 100 dollars per barrel.
Meanwhile, gas prices have increased and are at their highest level so far this year. Strong cooling demand in Asia and Southern Europe, as well as Ukrainian fighting near an important gas intake point in Russia –actual flows have hardly been impacted yet – and upcoming maintenance in Norway, a key supplier for Europe, have send prices upwards. Dutch TTF one-month ahead currently trades at EUR 40 per MWh, compared to February’s low of EUR 23. It is fair to say, however, that the price is far below last year’s highs and pretty much comparable with that a year ago. Prices are likely to increase further towards the end of the year and into next. On top of the usual seasonality in prices in Autumn and Winter, a transit deal between Russia and Ukraine is coming to end this year and unlikely to be renewed. A deal between the EU and Azerbaijan to make up for that loss is being negotiated, but hasn’t been concluded yet and there are no guarantees it will be.
Rising energy prices from recent lows are not a major cause of concern yet, and a crisis as witnessed between 2021 and 2023 isn’t imminent. But inflationary risks stemming from the energy complex are certainly not behind us either, with the situation in the Middle East continuing to pose the largest fat tail risk.
Tyler Durden
Fri, 08/09/2024 – 13:20
