


Mapping Average IQ Score By State
Intelligence Quotient (IQ) scores are a measure used to assess human intelligence through standardized tests. These scores compare a person’s cognitive abilities to the average population, with the average score typically falling around 100.
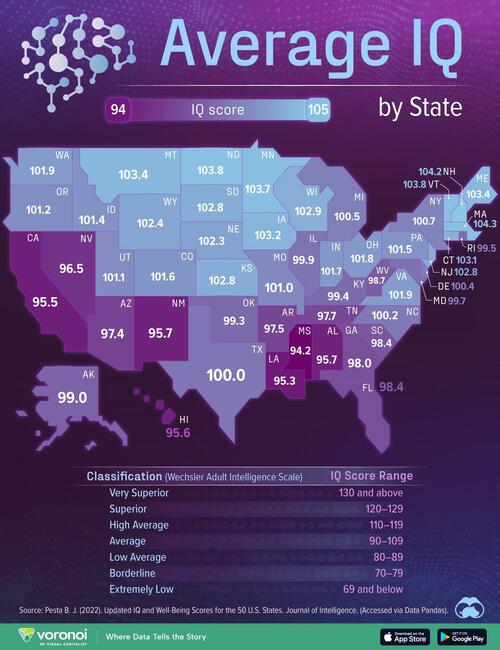
To see how IQ varies across the United States, Visual Capitalist’s Marcus Lu visualized data from a 2022 report published in the National Library of Medicine (Journal of Intelligence) by Bryan J. Pesta titled Updated IQ and Well-Being Scores for the 50 U.S. States.


This data can also be easily accessed via Data Pandas or through the scientific research paper itself.
Data and Methodology
IQ estimates are based on an analysis of exam scores from the Program for the International Assessment of Adult Competency (PIAAC) for adults, and the National Assessment of Educational Progress (NAEP) for fourth and eighth grade children.
The PIAAC is a large-scale international study of key cognitive and workplace skills of adults, while the NAEP is the largest nationally representative assessment of student capabilities in public and private schools in the U.S.
Note that IQ scores have their limitations, and do not capture all aspects of intelligence such as creativity or emotional intelligence. The numbers we used to create this graphic are listed in the table below.
| Rank | State | Average IQ |
|---|---|---|
| 1 | Alabama | 95.7 |
| 2 | Alaska | 99.0 |
| 3 | Arizona | 97.4 |
| 4 | Arkansas | 97.5 |
| 5 | California | 95.5 |
| 6 | Colorado | 101.6 |
| 7 | Connecticut | 103.1 |
| 8 | Delaware | 100.4 |
| 9 | Florida | 98.4 |
| 10 | Georgia | 98.0 |
| 11 | Hawaii | 95.6 |
| 12 | Idaho | 101.4 |
| 13 | Illinois | 99.9 |
| 14 | Indiana | 101.7 |
| 15 | Iowa | 103.2 |
| 16 | Kansas | 102.8 |
| 17 | Kentucky | 99.4 |
| 18 | Louisiana | 95.3 |
| 19 | Maine | 103.4 |
| 20 | Maryland | 99.7 |
| 21 | Massachusetts | 104.3 |
| 22 | Michigan | 100.5 |
| 23 | Minnesota | 103.7 |
| 24 | Mississippi | 94.2 |
| 25 | Missouri | 101.0 |
| 26 | Montana | 103.4 |
| 27 | Nebraska | 102.3 |
| 28 | Nevada | 96.5 |
| 29 | New Hampshire | 104.2 |
| 30 | New Jersey | 102.8 |
| 31 | New Mexico | 95.7 |
| 32 | New York | 100.7 |
| 33 | North Carolina | 100.2 |
| 34 | North Dakota | 103.8 |
| 35 | Ohio | 101.8 |
| 36 | Oklahoma | 99.3 |
| 37 | Oregon | 101.2 |
| 38 | Pennsylvania | 101.5 |
| 39 | Rhode Island | 99.5 |
| 40 | South Carolina | 98.4 |
| 41 | South Dakota | 102.8 |
| 42 | Tennessee | 97.7 |
| 43 | Texas | 100.0 |
| 44 | Utah | 101.1 |
| 45 | Vermont | 103.8 |
| 46 | Virginia | 101.9 |
| 47 | Washington | 101.9 |
| 48 | West Virginia | 98.7 |
| 49 | Wisconsin | 102.9 |
| 50 | Wyoming | 102.4 |
From this dataset, we can see that the average IQ score by state ranges between 94.2 and 104.3. These scores are all considered “average intelligence” by the Wechsler Adult Intelligence Scale.
The top three states are Massachusetts (104.3), New Hampshire (104.2), and North Dakota (103.8).
Massachusetts’ higher score average could be due to several factors. For starters, the state is home to prestigious universities like Harvard and MIT, which may contribute to a more academically focused culture. It also has a relatively high median household income, meaning families could have greater access to educational tools.
If you enjoyed this graphic, check out this ranking of U.S. universities by their number of startup founders on Voronoi, the new app from Visual Capitalist.
Tyler Durden
Mon, 09/30/2024 – 06:55