


US Wage-Price Spiral Is Still Persistent
Authored by Law Ka-chung via The Epoch Times,
The persistent inflation poses difficulties for both policymakers and researchers. However, this is not anything new, and it has already been well-documented since the era of John Maynard Keynes in the 1930s. I quickly ran a few regression analyses using a full sample of U.S. core CPI inflation (excluding food and energy) data and found various forms of autoregressive (AR) models resulting in quite long statistically significant lags. In one version, the 4th to 12th lag terms were all significant, suggesting inflation persistence could last for almost a year.


Traditionally, well-established models explained this kind of price stickiness. The typical taxonomy goes along two dimensions: whether there are market imperfections in the labor or goods market and whether markets are clear. The resulting four kinds of models are the worker-misperception model (labor market imperfection), imperfect-information model (goods market imperfection but clear), sticky-wage model (labor market imperfection and not clear), and sticky-price model (goods market imperfection and not clear), respectively.
Nevertheless, these assumptions are less valid nowadays. In this AI and big data era, market imperfection is much reduced, if not completely eliminated. Markets not clearing is not a common assumption adopted in the popular general equilibrium type of models. While pricing can be adjusted relatively quickly, wages cannot. Under standard labour contracts, wage reduction is uncommon, while the increase is usually done on a yearly basis. Life will be much easier if price stickiness is explained by wage stickiness, as is the case with most modern models.
Thus, the wage-price spiral hypothesis is essential for linking the two. If established, inflation stickiness can be explained by unemployment stickiness, which is also consistent with the Phillips curve framework. The accompanying chart checks whether the spiral is there.
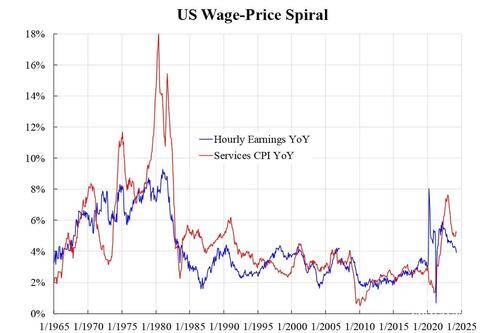
U.S. Wage-Price Spiral. (Courtesy of Law Ka-chung)
The blue line shows the hourly earnings year-over-year (YoY) growth, which is the median for all workers from the third quarter of 2007 and, prior to that, the average for production workers. The red line shows CPI YoY growth for services only. The reason for narrowing down CPI to services only is that this takes up 64 percent of the basket, and this category is seen to be highly resistant.
From the chart, we observe the following.
-
First, services inflation still stands at a very high level of 5.2 percent.
-
Second, while price growth was much higher than that of wages around 1980 due to uncontrolled inflation expectations, nowadays the two co-move suggesting inflation expectations are probably well anchored.
-
Third, the hourly earnings growth and services inflation have been similar in level since the mid-1990s (that is, for a quarter century). Fourth and most importantly, the uptrends for both since 2010 are clear, suggesting such inflation pressure has been there for a long time.
As the high base period has passed, the observed inflation in upcoming months will be higher than the recent ones. Earnings inflation easing has been slowing to 4 percent. Based on the third observation just mentioned, services inflation and, hence, the overall level is likely to be maintained at a similar level, that is, 4 percent for some months ahead.
Tyler Durden
Fri, 06/07/2024 – 22:15