

Visualizing How Homicide Rates In US States Have Changed Since 2012
How much safer or more dangerous is the United States? The answer largely depends on the specific metrics used, and compared to when.
For instance, if we look at state-by-state homicide rates from 2012 to 2022, there’s a noticeable increase in most states. However, these rates are still below those recorded in the 1980s and 1990s.
A graphic from USAFacts offers an analysis of age-adjusted homicide rates across states for the period from 2012 to 2022, illustrating these changes. This analysis utilizes CDC data covering 46 states, with New Hampshire, North Dakota, Vermont, and Wyoming lacking available data.
Comparing States by Homicide Rates
As Visual Capitalist’s Omri Wallach notes, from 2012 to 2022, homicide rates increased in every state with available data except for Connecticut, New Jersey, and Rhode Island. Here are the rates for all 46 available states as well as their 10-year change in percentage:
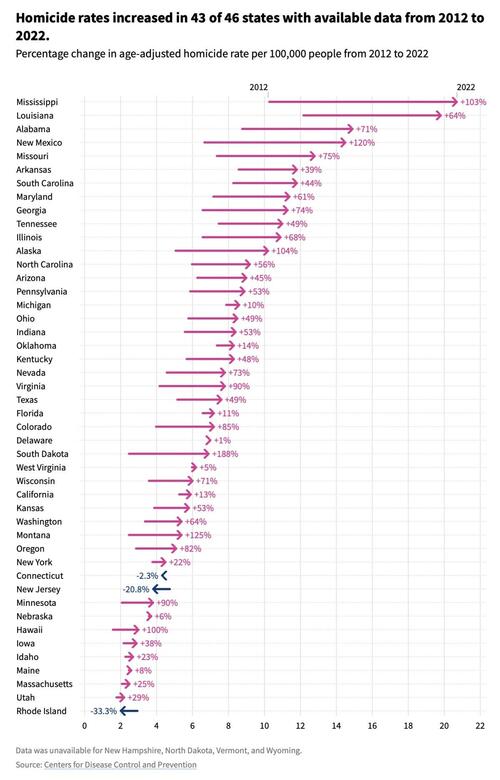
Mississippi had the largest increase in homicide rate, more than doubling from 10.2 to 20.7 per 100,000 people. New Mexico (up 7.9 homicides per 100,000 people), Louisiana (up 7.7), Alabama (up 6.2), and Missouri (up 5.5) had the next-biggest increases.
Murder rates doubled in at least six states over the decade: South Dakota (+188%), Montana (+125%), New Mexico (+120%), Alaska (+104%), Mississippi (+103%), and Hawaii (+100%).
Tyler Durden
Wed, 06/12/2024 – 05:45
