


What’s Changed? What’s Different This Time?
Authored by Charles Hugh Smith via OfTwoMinds blog,
This raises another question: how will the deflation of the Everything Bubble play out?
Causes generate effects. As noted in my previous post, if causal conditions have changed, the „guarantee” offered by statistics is empty. This leads to a simple question: what’s changed? Have the causal conditions changed enough to generate different results?
The status quo assumes the economy never really changes, and so the stimulus that worked last time will work again. This ignores the fundamental reality that change is constant and once causal conditions change, the effects will necessarily change as well.
So what’s changed in the 42 years since 1982? Why 1982? 1982 marked the end of the stagflationary 1970s and the start of the 40+-year bull market in stocks, real estate, and until recently, bonds.
1. China was just emerging from the Cultural Revolution. After 40 years of astounding growth, it’s struggling.
2. Debt levels across all sectors–public, corporate and household–were low compared to the present.
3. The global Baby Boom was entering peak earning, household formation, home buying, and starting enterprises. Now they’re retiring and entering the phase of selling assets to downsize and fund retirement.
4. Computer technology entered the mainstream economy and boosted productivity. Now we have AI but its long-term effect on global productivity is unproven.
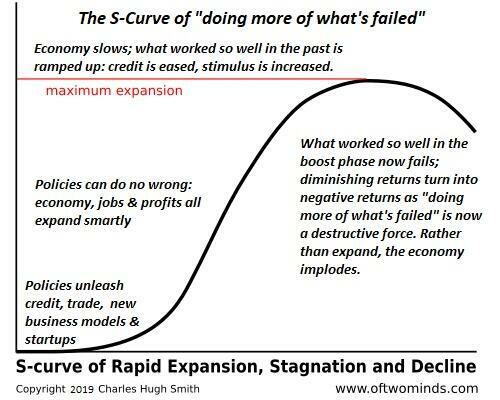
5. Diminishing returns are manifesting across the global economy, as what worked so well in the boost phase no longer generates the same results.
China has changed in many ways. Scale matters. When a company is small and it boosts revenues by $1 billion, the stock rockets to the moon. Once it’s a trillion-dollar company, adding $1 billion no longer has the same effect. In fact, it’s a red flag that growth has slowed. Once profit margins slip, the stock crashes, as the growth story has ended.
The same causal conditions are present in China, which has reached a vast scale at the top of the S-Curve. China boosted its economy for decades by inflating an unprecedented real estate bubble, which created an enormous wealth effect in its burgeoning middle class. But all bubbles pop, and the concentration of household wealth in real estate means the decline is obliterating the heady sense of confidence generated by soaring assets.
China has also reached limits in exports and domestic consumption, for a variety of reasons.

The „never fails” China credit impulse has failed. Every economy that depends on expanding credit for its growth eventually enters a liquidity trap, where lowering interest rates and lending standards no longer boost assets or consumption because 1) households are wary of adding more debt or 2) households cannot afford to add more debt, even at low rates of interest.
China is also mired in the middle income trap, where the elite holds the majority of wealth and the rural populace is still earning very low incomes.
China pulled the global economy out of the 2008-09 Global Financial Meltdown, that’s not going to happen again. Once causal conditions change, so do the results.
The astounding expansion of credit/debt globally is an example of how a „solution” generates „problems” that only get worse the more „solution” is applied. Flooding the economy with low-cost credit works wonders when debt levels are low and there is pent-up demand for credit.
But once an economy is saturated with credit and staggering under the weight of servicing existing credit, adding more debt creates a problem more credit cannot solve: the greater the burdens of debt, the higher the risks of default.
Global debt has been rising on the shaky foundation of the Everything Bubble: as assets have bubbled higher, they expand the collateral available to borrow against. Once the bubble pops, then the collateral evaporates and the lender is under water: the assets is worth less than the loan amount. There is no escape for either borrower or lender.
Demographics have changed. The massive global Baby Boom is exiting the workforce and starting to liquidate assets to fund retirement. This transition from buying assets to selling assets raises the question: who will buy all these assets at today’s nosebleed overvaluations? Younger generations lacks the capital and income to buy assets at these levels of overvaluation, and there is nothing on the horizon that could change that asymmetry.
Selling pushes down asset prices, which then reduces the collateral supporting global debt, which then lights the fuse of a credit crisis that can’t be resolved by lowering credit and lending standards. Diminishing returns are not reversed by doing more of what’s failed–they’re accelerated into unstable crises by doing more of what’s failed.
As for the hype that AI is going to save us: what we see as causal conditions are stupendous expenses, not gains in productivity. Economists puzzled over the „productivity gap” in the 1980s as new technologies entered the mainstream economy: companies and households were buying the new technologies but productivity wasn’t responding as expected.
Rosy projections are not causal; real productivity gains take time, and don’t always play out as projected. If AI eventually boosts productivity across the entire economy, is may take a decade to play out. The current credit-asset bubble that’s popping will not be „saved by AI.”
This raises another question: how will the deflation of the Everything Bubble play out? Richard Bonugli and I discuss this in our new podcast How Asset Deflation Could Play Out (35:37 min).
There are two basic scenarios, and which one plays out depends on the causal conditions emerging in the present.
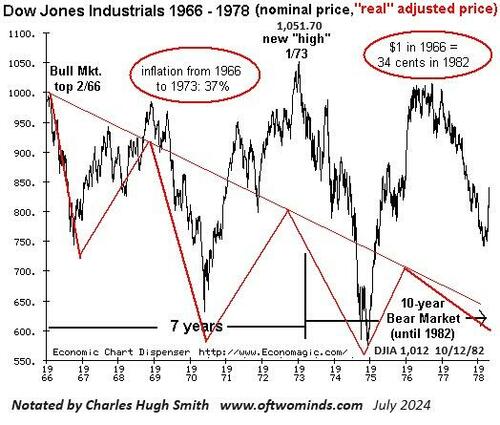
One is a massive deflation in the real-world value of assets hidden behind a stagflationary rise in nominal asset values, per the 1970s. When the Dow Jones Industrial Average finally exceeded its old high around 1,000 in 1982, everyone who had held on through the 1970s cheered: „we’re whole again! We got our money back!” Alas, the purchasing power of the Dow 1,000 stocks had crashed by 57% since the 1973 stock market top of Dow 1,051 and by a staggering 66% since the Dow top in 1966.

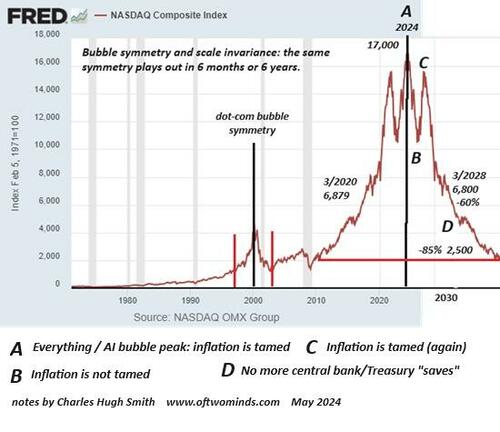
The other scenario is a no-frills crash. I prepared this chart of the Nasdaq stock index based on bubble symmetry. Crashes come in a variety of flavors, but the end result is the same.

What’s changed? Many things. What will be different about the results? That is unknown, but we do know that statistics drawn from previous sets of causal conditions have no bearing on what happens in the current causal conditions. This time is different isn’t always what we expect; it can also play out with extreme prejudice.
* * *
Become a $3/month patron of my work via patreon.com.
Subscribe to my Substack for free
Tyler Durden
Thu, 09/26/2024 – 20:05