


Why Stocks Are Melting Up: A Real-Time Peek Below The Market’s Surface
Next week, our friends at SpotGamma are launching an extremely useful trading dashboard called Trace, which will bring Wall Street-level analytics to ordinary traders: analyzing dealer gamma exposure on a minute by minute basis, the application will provide real-time insight on key market levels, including zones of support, resistance, and volatility, hinting at potential breakout or breakdown levels, and warning of potential major moves in the immediate future.
Here is an example of what to expect.
As SpotGamma’s Brent Kochuba notes, post-FOMC we find the S&P in a very unique position: negative gamma to the upside. This implies that the big positions are traders long SPX calls, which places dealers in a chasey, negative gamma stance (hence today’s meltup).
As regular readers are aware, negative gamma implies dealers are buying futures as the SPX moves higher (and alternatively selling or shorting when the SPX drops). Clearly yesterday’s FOMC & its 50 bps cut has equity momentum focused on the upside, with a big target at 5,750.
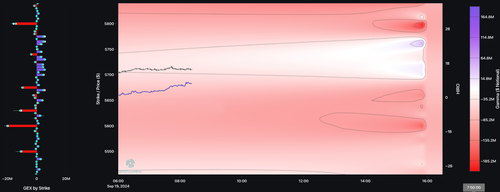
Negative gamma (red) is depicted in the SpotGamma Trace map below, which uses a proprietary dealer positioning estimate to forecast SPX dealer hedging flows. Currently we model dealers having large short call positions at 5,675 & 5,800, which can be seen as red strikes on SpotGamma’s Trace map (left side).
For today, 5,750 is a short term area of “local” positive gamma, which is depicted in blue. Note that the blue is concentrated into 4PM, but disappears post-4PM. This is because the material positive gamma for today is driven by 0DTE positions, which expire at the close.
Looking ahead, this upside equity momentum plays into a massive 9/20 triple witching expiration. Into Friday & Monday, this expiration could force the closing and rolling of long call positions, which could temporarily stall upside equity momentum.
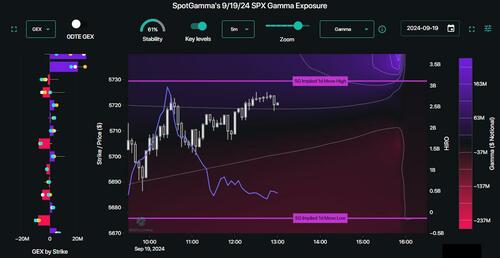
Fast-forwarding from this morning, a mid-day update shoes that a band of positive gamma emerges above 5,700, which implies market support at that level. As SpotGamma notes, much of this positive gamma was driven by 0DTE positions – including a 4k lot 0DTE call seller at 5,735.
These supportive dealer positions are showing the SPX tracing a path up into 5,735 for the close (which is the white zone on the chart at 4pm ET).
What is unique about Trace is that unlike SpotGamma’s previous offering, which showed intraday Delta flow, we can now add a layer of dealer gamma as it also changes in real-time, which to many advanced traders is the holy grail of flow analytics.

We will be watching Trace closely to see how positions shift into and out of OPEX, as we continuously update positions throughout the trading day(s).
Readers who want to get an advance look at the features of Trace, which will be officially launched next Tuesday, can do so at SpotGamma’s website here.
Tyler Durden
Thu, 09/19/2024 – 12:58